Showing posts with label discussion. Show all posts

More FEEDBACK & SUGGESTIONS

on Friday, 14 December 2012
Showed progress to the technical supervisors (Kelvin), and also approached to Yi Wei. More suggestions and ideas/thoughts are given by them. Changes are hopefully to be made in order to improve the user experience for my website. It's very time consuming as I have to reconsider the flow of my content (website), although the ideas are great. However, the changes should have made earlier as I have planned to spend the rest of seven weeks for the technical aspects, therefore the final interface should be done before week 8. More feedbacks and suggestions are good, but I personally feel that it also confuse the students as the direction of the idea has changed and students have no much time left to refine and continue the rest of the work, although students have to take consideration of the feedback given to them in order to improve.

Kelvin's feedback
  • enhance and improve the motion graphic parts (make it more engaging and eye-catching)
  • use After Effect instead of Flash to create the animation/motion graphic as Flash has limited presets while After Effect offers more presets. Import video into Flash and make it interactive. Using cue point to select specific timing/part within the animated graphics / video. 
  • research more on motion graphic websites
Yi Wei's feedback
  • emphasize on friends' result (FB)
  • make use of friends and social media to attract users to stay
  • after users have answered the question, straight away display friends' results. 
  • try to blend in friends' result section with the information. 
  • for the find out why session, insert some questions or quiz that engage users to participate instead of just allowing them to explore, because user may feel bored and leave the website. 
  • to create a strong selling point/idea of my project which is it can lead to discussion among users and make it go viral. 
After listing out all the feedback, I agreed with Yi Wei's feedback because I think they really help to improve user experience of my website and make the flow of my content go smoother and easy to navigate for the users. Integrating with social media is the advantage of the website as it attracts more users to participate. However, I foresee some obstacles in technical aspects that I will be facing when comes to the production stage. Lots of data storing coding have to be handled (if we are not allowed to create just a prototype). Besides, I am still not sure whether if I am able to achieve the outcome that I wanted and implement my idea practically in terms of the scripting. 

After receiving the feedback, I quickly thought of some websites and games that I have been visited to that have similar concept. The first one is Twitter data-generated infographic website which will display the infographic between two twitter users. Comparison between the users will be made such as the tweets, number followers and etc.... That is interesting because users get to see the difference between he/she and their friends (or it can be random celebrities). 


Another thing that came to my mind is The Walking Dead pc game. The game consists of few episodes and the ending of each episode, there will be some kind of analysis. From the analysis, players get to see the percentage of he/she and other players that have chosen the same path/respond while playing the game. For example:


I find this interesting as well because we get to see how similar our chosen response is with other players. This also helps to increase the interactivity between players and game. I think I can implement the concept onto my website.

Feedback from peer (WIP)

on Monday, 10 December 2012
Today we had a WIP session during class hour with classmates (Kar Yann, Wee Nee and Sze Kei) on our individual projects. I have mentioned about my problem which is to figure out a way (non-linear form, as linear form seems boring) to encourage users to select/interact with all the buttons so that all the related information will be viewed. They provided me some useful suggestions in class and I thought that are really helpful.

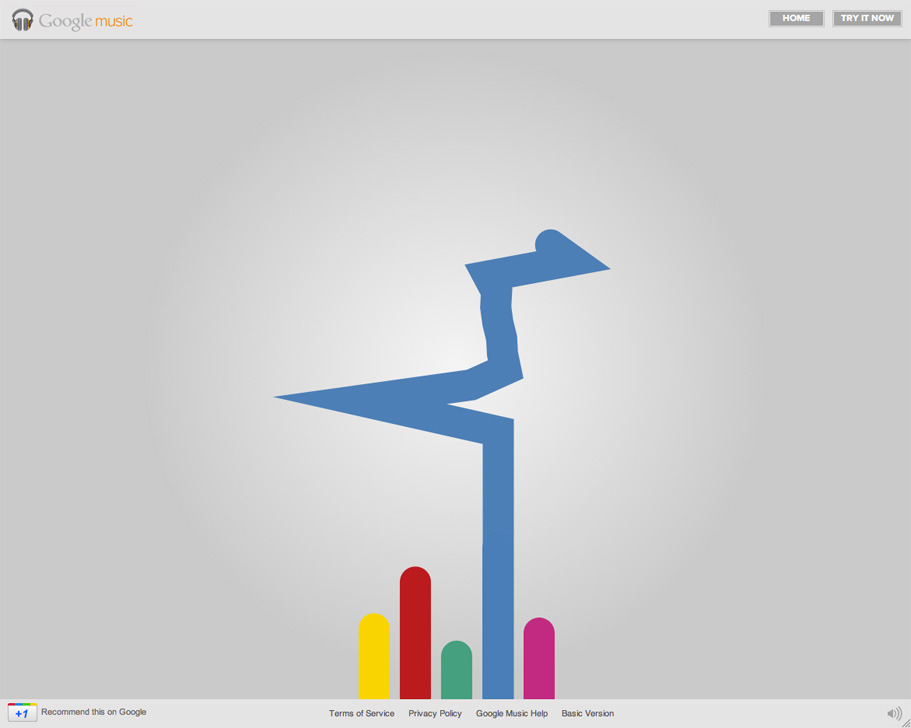
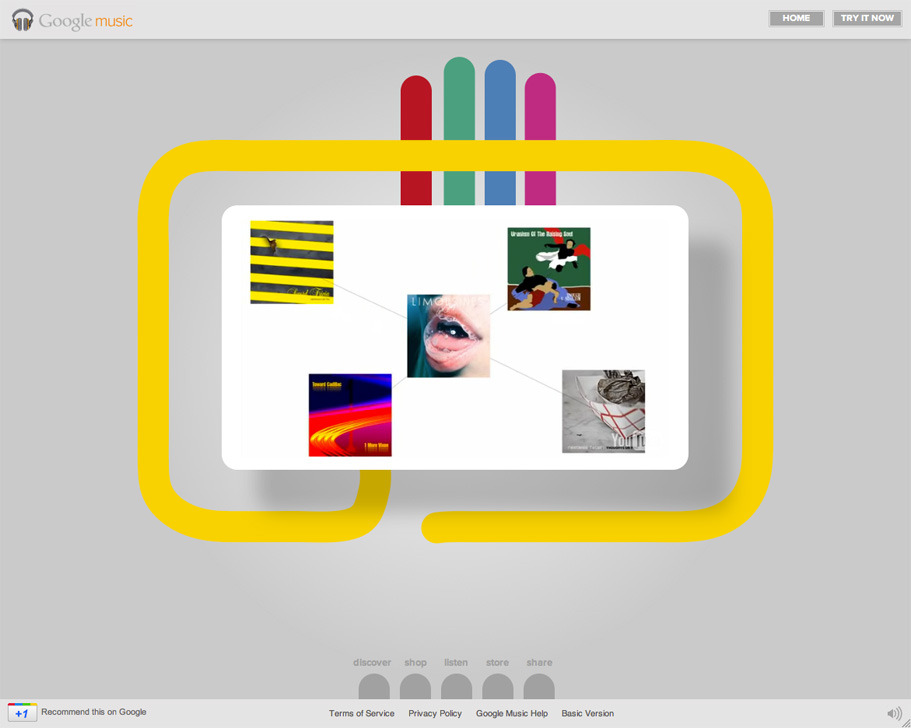
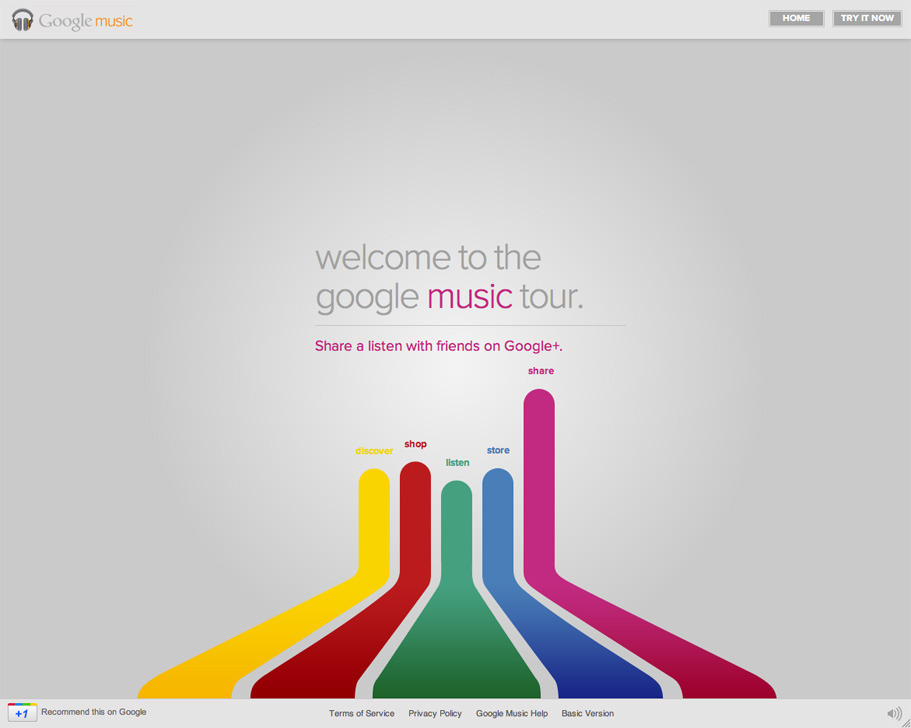
Both Kar Yann and Weenee suggested that the visual plays the important role in order to catch audiences' attention and also to enhance the curiosity of them so that they would interact with the buttons. Besides, we also realised that transition and animation are also useful in terms of grabbing audiences' attention and encouraging them to participate more. They have given me a reference which is Google Play:

Each colour stripe represents different categories. the upbeat animation and transition encourages the users to continue clicking the next colour stripes to find out more.


source: http://work.egosmoke.com/GOOGLE-MUSIC

I thought that this is a very good reference for my infographic part in my website and I am going to plan  the interactivity as well as sketch out the interface design of the information page again by using this as reference. 

Tutorial with technical supervisor

on Friday, 16 November 2012
Had tutorial session with lecturer and technical supervisor, Kelvin. He has pointed out some several advices towards my project. The advices/suggestions he gave were written on my notebook and were being highlighted. Besides, I have also do some quick response to his feedback under the highlighted notes (as shown as the image below). My response includes whether I agree and disagree with his feedback. Reasons are provided. 


https://dl.dropbox.com/u/23409639/photo-1.JPG

He mentioned that my website needs something attractive to keep users coming back often. He suggested it can be data tracking. I agreed with him because now my websites has nothing to attract the users to come back to navigate again. It would probably be like some other informative websites where users usually just seen once and they are not returning to the website anymore. Data tracking is interesting because it allows users to keep coming back to check what's new or what are difference every time they logon to the website.

He also suggested to add infographics/ statistic from various aspects as informative. The infographics can be interactive and dynamic (meaning it might be varied according to the data given by the users). He said that my website lack of interesting elements/features that make it attractive enough to keep users coming back. Therefore I am agreed with this suggestion and decided to add more informative content to the users by using interactive infographics.

discussion // tutorial

on Friday, 10 August 2012

Sticking to the concept: magnifying, I have to come out with the content of my website. I have discussed with my lecturer about the content yesterday but in the end we realised that there are some parts missing in order to link the content as a whole. I have to really think of the content that able to deliver the message to the audience as it's most important thing. For now, my content that I have planned and proposed seems not working as the audience might not know the relation between eating meat and global warming.

Discussion // Thoughts

on Friday, 29 June 2012
After done researching on user experience and I started to brainstorm and decide on my user experience. As my project is about bringing awareness to audiences on meat consumption causes global warming and I want show them how serious it is until there is a need to reduce meat intake, and my concern is how do I let my audiences to remember this subject and how do I make the effect after reading/interacting the website more lasting. And after the research on negative events/information that I have done, I realised that actually bad things or negative outcome will leave bigger impact on the audiences. Therefore, I have decided on my user experience which I want my audiences to feel scare after using the website as my objective is want them to remember and I want the effect to be long lasting.

So after I brainstorming, I came out with a solution which is to decide the main feature of my website. In order to bring scariness and seriousness from the website to the audiences, I thought that the most easy way is to relate things around the audiences such as things they are familiar (friends, family, places, etc...) so that the audiences are able to feel that they are in the situation itself. And I thought that social media is the effective way to bring all these things and link them together because it is easily to get data from these social media. I have decided to use social media such as Facebook or Twitter to bring in audience's data to the website and form the content. I was thinking to bring data such as audience's friends/family in Facebook or followers in Twitter and turn them into the characters in the website (content).


Hence, I need to start thinking, brainstorming and creating a narrative for my website in order to link all the thinks together with the content about meat consumption and the effect of it.